Learning objectives: at the end of this lesson you should be able to-
- Accurately answer questions based on reading a spreadsheet.
- Calculate the relative percent change between two numbers.
- Calculate the absolute percent change between two numbers.
- Answer basic statistics questions.
- Argue a thesis using per capita GDP and an article from our Normandale Library databases.
Background: What is a percent change?
You see the use of percents all the time in the news. Medical studies report "a 50% increased effectiveness," the state highway patrol may report "14% fewer traffic accidents," or a commercial may claim "50% whiter teeth." People use of percentages to convince us of the importance, accuracy, or effectiveness of their idea. And yet, without a basic knowledge of how to calculate percentages, we may be persuaded of the importance, effectiveness, or usefulness of an idea – contrary to our best interests. Most people recognize this challenge with percent changes, and conclude to either ignore or believe percent change claims when evaluating the credibility of evidence.
So too in history, a failure to understand percent change can influence a historian’s analytic conclusions. Does a 10% increase in the per capita GDP dramatically improve a countries overall quality of living? As we’ll see, it depends on what counts as "10%."
There are two main ways of thinking about percent: absolute percent change and relative percent change.
Let’s work with examples: You have 100 sheep. One dies this year due to illness. So, you have a 1% mortality (death) rate. If next year with 100 sheep, 2 sheep die, you have a 2% mortality rate. If you want to know how much the mortality rate has gone up, you could subtract 2%-1%, and your absolute percent change is 1%. However, if you want to calculate the relative percent change you have to subtract 2%-1%, divide by the original % (1%) and then multiple by one hundred. 2%-1% = 1% divided by 1 is 1 times 100 = 100%. So, the relative percent change is that your mortality rate increased 100%. The equation is ((b-a)/a) x 100 for relative change.
The equations for change are
Absolute percent change: (b%-a%)
Relative percent change: (b-a)/a) x 100
Saying that the mortality rate increase by 1% or 100% are both accurate statement, but which number do you feel captures the importance to a farmer?
People use absolute percent change and relative percent changes all the time in history. For example, you could say the plague killed 40% of the populace in the middle of the 13th century (an absolute percent change) or you could say the mortality rate went up 400% (population in 1300 was 100 million, population in 1400 was 60 million).
Important: if you only have two numbers to begin with, you only calculate absolute change (b-a) and relative percent change (b-a)/a) x 100.
Questions this assignment addresses: How can we use numbers to understand our past? You will read, use websites and a spreadsheet, answer questions, and submit your answers to your Assignment file.
1. For the first part of this lesson, please play a game.
Go to http://www.shodor.org/interactivate/activities/SimpleMontyHall/
Play the game. Do you understand why you should always switch?
If not, go to http://webs.wofford.edu/bednarjt/monty/montyhall.html for an explanation.
2. Why do historical statistics matter?
Let’s tackle that one word at a time, backwards. Statistics matter because we use numbers to measure our lives, whether it’s the dollars in our bank account, the number of friends we have on snapchat, or how full a glass is (half full?) Increasingly, statistics are used to convince us in the truth of an argument. Yet, without a basic understanding of statistics, people often fall back into the cynicism that all numbers lie. Numbers are just information, and just as we apply the SIFT process to sources, so too can we apply certain standards for what is a credible statistic.
Why do statistics matter to history? Numbers show us trends, that is up or down, in parts of our lives that are important. How much food, per person, does one society provide over time? How is income distributed to a people, mostly to the rulers, or does every group have a sizable chunk? As well, numbers let us compare groups that are fare apart from each other in geographic or temporal terms. Did the Han Chinese of 100 CE have greater economic output than the Holy Roman Empire in Europe of 100 CE? Statistics matter because we can see trends (changes over time) and comparisons.
3. What is an average? Questions to answer.
To start, let’s deal with a simple concept: an average. There are three types of averages, the mean, median, and mode.
For a text definition of these terms, see https://www.thoughtco.com/the-mean-median-and-mode-2312604
For video explanation, see https://www.khanacademy.org/math/probability/data-distributions-a1/summarizing-center-distributions/v/mean-median-and-mode
Questions: Please answer Let’s say a large village had 25 people die in a single year. Below is the age of each deceased villager.
- I. Average the following ages: 1, 1, 1, 1, 1, 1, 1, 1, 1, 5, 6, 9, 18, 18, 35, 45, 58, 72, 73, 75, 78, 88, 92, 107, 110. (25 numbers).
- II. What is the mean age of death in this town?
- III. What is the median (number in the middle of s string of numbers) age of death for this town?
- IV. What is the mode (most commonly occurring number in string of numbers) age of death for this town?
- V. If you are 34 years old, are you scared of dying next year? Why or why not?
As a historian, when you see the word "average" you always need to ask if it’s the mean, median, or mode and is that the most useful average for understanding the past.
If you’d like more help understanding mean, median, and mode, you can see a video here.
Questions
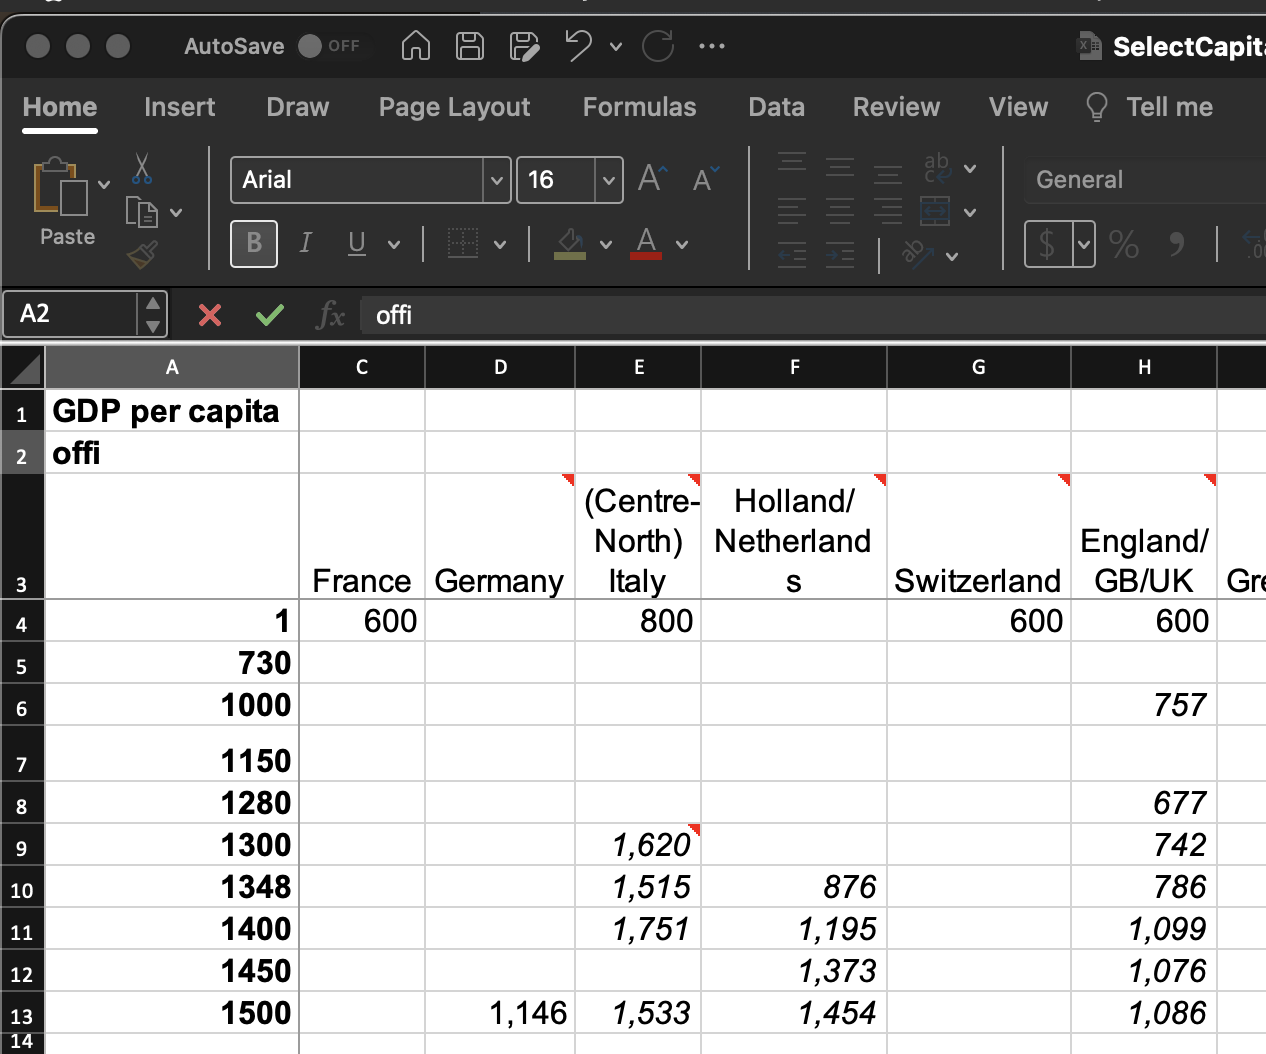
For this assignment you’ll need to open the spread sheet on per capita GDP in a spreadsheet program, such as Google docs, Microsoft Excel, or Mac Numbers. Clicking this link will download it to your computer, and you can then open the file in the spreadsheet program of your choice. Dragging the file on top of an open spreadsheet program will often open the file.
Below you’ll see roughly what the spreadsheet looks like.
Terms
- Per capita: for each person in a country or region
- Gross Domestic Product: how much value in terms of goods and services a country makes.
- Per capita GDP: how much value each person contributes to a country-wide measure of production.
- GK$: A "a hypothetical unit of currency that has the same purchasing power parity that the U.S. dollar had in the United States" in 1990. (https://en.wikipedia.org/wiki/International_dollar)
- What is the absolute change (b-a) of Japan’s per capita GDP growth between 730 CE and 1450 CE?
- What is the relative percent change [(b-a)/a) x 100] of of Japan’s per capita GDP growth between 730 CE and 1450 CE?
- What is the absolute change (b-a) of Iraq’s per capita GDP growth between 730 CE and 1150 CE?
- What is the relative percent change [(b-a)/a) x 100] of of Iraq’s per capita GDP growth between 730 CE and 1150 CE?
- What is the absolute change (b-a) of Egypt’s per capita GDP growth between 730 CE and 1280 CE?
- What is the relative percent change [(b-a)/a) x 100] of of Egypt’s per capita GDP growth between 730 CE and 1280 CE?
- What country had the greatest absolute change in per capita GDP during the period from 1 to 1500 CE? This change can be withing the period 1-1500 CE, it does not need to be only the years 1 or 1500 CE.
- What country had the greatest relative percentage change in per capita GDP during the period from 1 and 1500?This change can be withing the period 1-1500 CE, it does not need to be only the years 1 or 1500 CE.
- Using one of the Library Databases (Gale Virtual Reference Library, Daily Life in History, etc), to explain why change may have occurred in Japan, Iraq, or Eqypt in a short paragraph (3-5 sentences)
- Find an article from a credible website (points only for credible websites) about history before 1400 that uses a percent change and include the citation (URL or full citation) and whether you think the percent change is absolute or relative and why you draw this conclusion. Searching for "name of dynasty" or "XX century" or "medieval" and "country" with "%" will yield answers quickly.
Time expectation:
I expect this lesson plan to take approximately 1.5 hours, depending on the research involved.
Grading criteria
Student:
- Accurately answered questions based on reading a spreadsheet.
- Calculated the relative percent change between two numbers.
- Calculated the absolute change between two numbers.
- Argued a thesis using per capita GDP and an article from our Normandale Library databases.
- Student selected a credible website for their percent change example.
- Student correctly identified the percent change as absolute or relative.